Power market surveillance for energy trading firms

FTR congestion monitoring

FTR auction data and virtual transactions sit in separate systems at most firms. BroadPeak aggregates auction award data across ISOs and brings it together with virtual transactions, surfacing concentration risks, forfeiture exposure, and potential manipulation in one platform. No other solution does this in one place.


BroadPeak Power Market Surveillance

Track every FTR award, node, and virtual position

Auction to alert, one view

With BroadPeak’s Power Market Surveillance solution, energy trading firms get FTR auction data, virtual transactions, and forfeiture screening in a single interactive platform, closing the gap between a suspicious pattern and an investigation.

ISO coverage

MISO, PJM, CAISO, ERCOT, NYISO, ISO-NE, SPP. Every major U.S. ISO auction market in a single platform, no need to stitch together multiple data sources.

Trade surveillance: Why data quality determines success

Trade surveillance programs succeed or fail based on data quality, not surveillance logic or alert sophistication.

See your full position

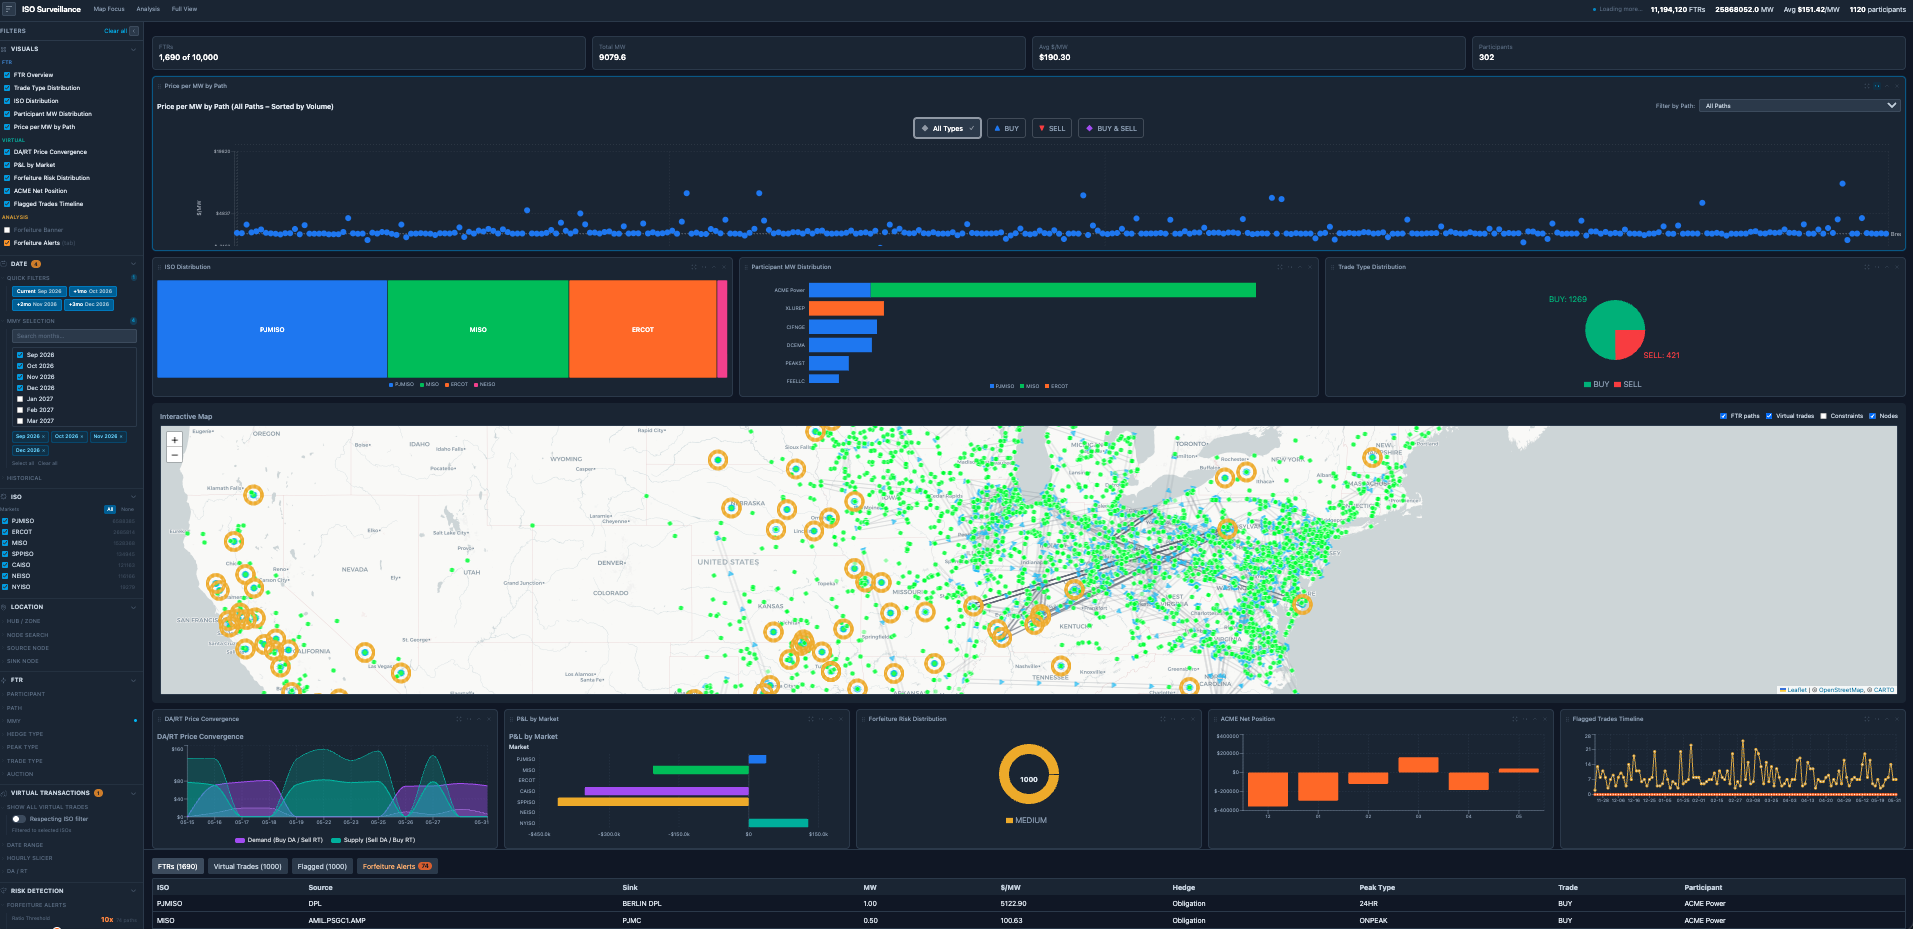
Three connected views: FTR positions, virtual trade P&L, and auction paths. Drill into any one and the others cross-filter with it, so you are never reconciling separate reports by hand.

FTRS

  • Trade Type Distribution: buy/sell, obligation/option visual with counts
  • ISO Distribution: by MW volume per market
  • Participant MW Distribution: concentration visuals
  • Price per MW by Path: full drill-down

Virtuals

  • DA/RT Price Convergence: area chart over time
  • Drillable P&L by Market/Node/Hour: top 10 horizontal bar chart
  • Forfeiture Risk Distribution: HIGH/LOW virtual rings
  • Flagged Trades Timeline: spikes indicate clustering

Interactive map

  • FTR paths displayed as direct source-to-sink lines in green
  • Nodes displayed as geo-tagged circles by ISO
  • Virtual trades at node level
  • Click on any path/node or ring to cross-filter the dashboard
  • Suspicious paths highlighted for inspection

Frequently asked questions

What energy trading firms ask about BroadPeak’s Power Market Surveillance solution

What data does BroadPeak ingest for congestion monitoring?

FTR auction award data loaded across ISOs with node-level granularity, combined with customer bid-to-bill virtual transaction data mapped to the same FTR nodes and paths, all from a single platform without stitching together multiple data sources.

DART spread visualization and the DA/RT convergence loop are data dependent. Real-time LMPs close the loop and surface spreads at each node when provided. Without RT pricing, the platform still shows virtual positions in the day ahead market.

Yes. A two-layer scatter drill-down takes you from path summary to individual FTR-level detail, with cross-filtering: selecting any visual (map, chart, or path) instantly updates every other visual and the data table.


Single platform, cross ISO. ISO-level distribution is shown by MW volume, with participant MW concentration visuals available at the market level.


Compliance and market oversight teams. Every alert carries a drill-down path and an evidence trail, from the flagged pattern back to the individual FTR or virtual trade behind it, so a finding is ready to hand to an investigation, not just a chart you have to explain.


How BroadPeak's Power Market Surveillance
solution works

Four-step surveillance process

BroadPeak ingests FTR auction awards and virtual transactions across ISOs, node by node. Configurable forfeiture rules and concentration checks flag high-risk activity, with drill-down to path, participant, and individual FTR level to support investigation.

Auction ingestion

FTR award data loaded across ISOs with node-level granularity.

Virtual bid integration:

Customer bid-to-bill data mapped to FTR nodes and paths.

RT price overlay

Real-time LMPs (when provided) close the loop, surfacing DART spreads at each node.

Scan and investigate

Forfeiture rules and concentration checks run across the full dataset, with drill-down to path, participant, and individual FTR level.
Auction to alert

Two views of the same data

Dashboard overview

See the whole market: historical trends, concentration by ISO and participant, and every FTR path mapped geographically, down to individual trade records, all without switching tools.

Investigation view

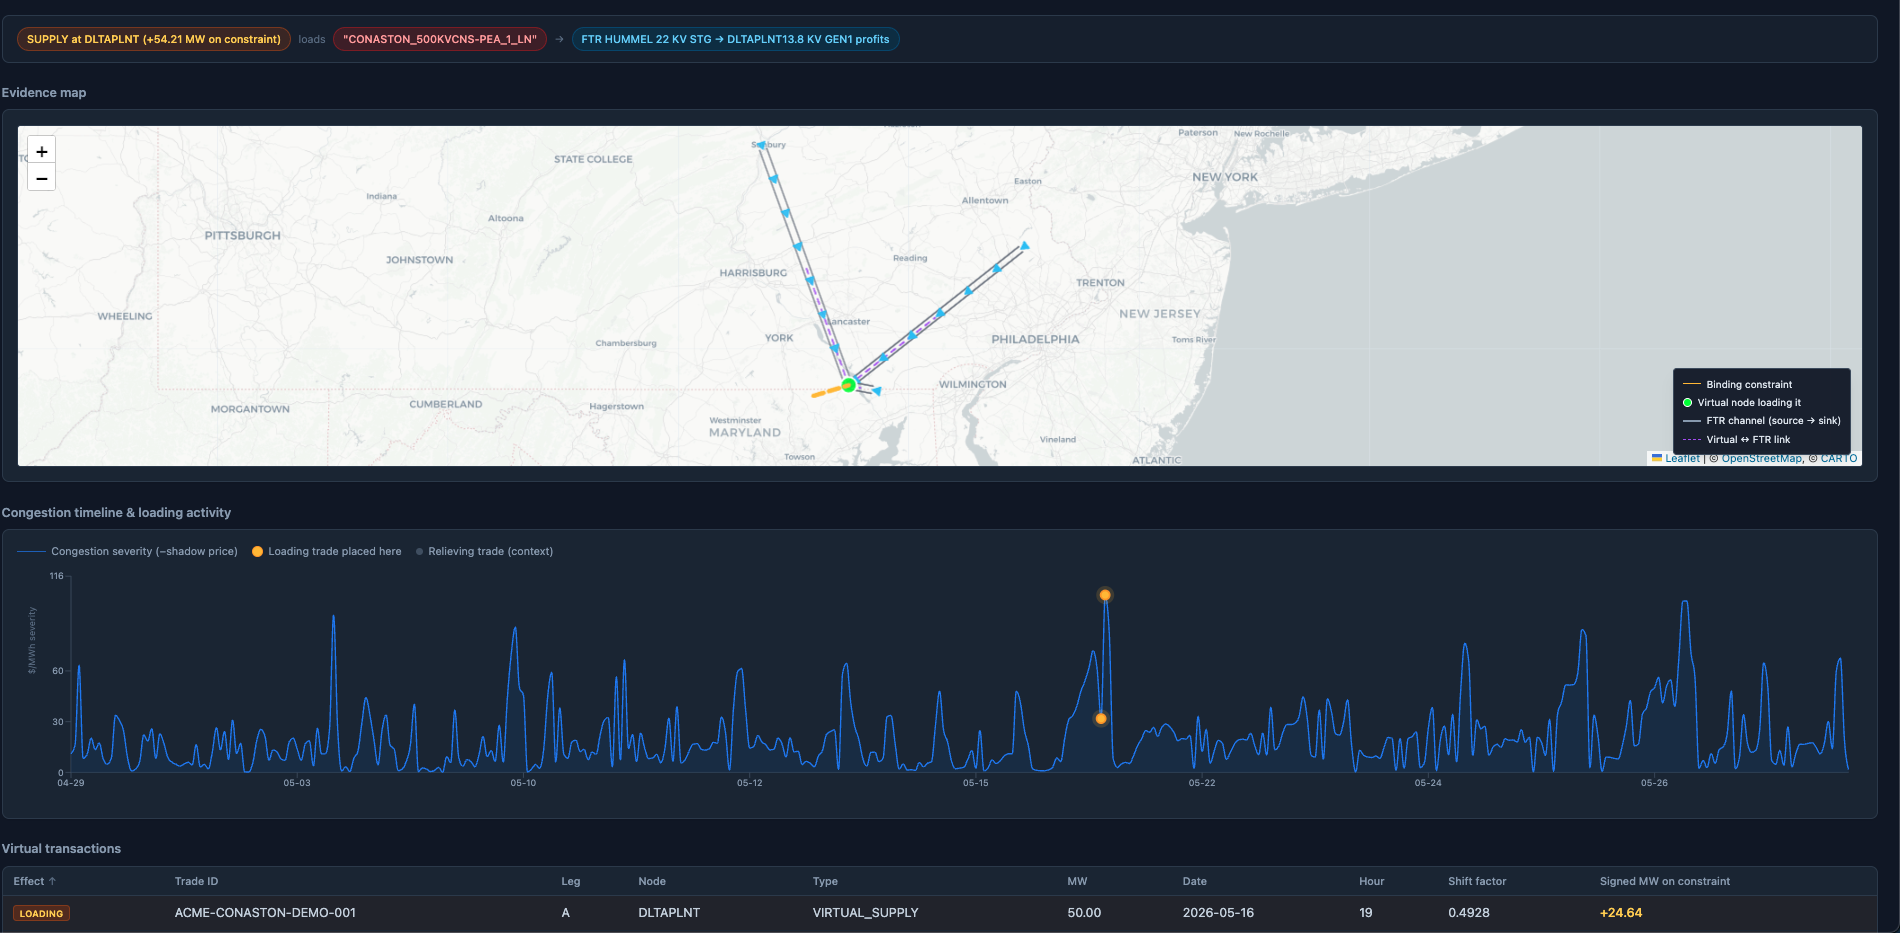
Drill down into any path or node to see FTR and forfeiture risk detail, with the map tracing that corridor and surfacing related activity in real time.

The company we keep

Clients

Enterprise grade infrastructure

Secure by architecture

Our secure managed hosting on AWS uses Virtual Private Clouds (VPCs) for robust protection, while easy-to-build data streaming ETL pipelines move data seamlessly to Redshift or Snowflake through a low-code interface.

Amazon Web Services logo, white with orange outline

Perspectives

Insights

BroadPeak’s Trade Surveillance solution gaining traction

Q&A exploring why BroadPeak’s Trade Surveillance solution is gaining traction across energy and commodity firms...
A young woman appears to glitch and fragment, symbolizing the merging of humanity with the digital world. A visual representation of contemporary themes such as AI, the metaverse and cyber culture

Trade surveillance: Balancing technology with human expertise

AI can process billions of records and detect patterns at scale, but can it explain...
Cargo ship surrounded by birds in front of urban landscape

Trade surveillance is not a box-ticking exercise

Compliance sets the boundaries for trading activity. Rules and limits are not there to restrict...

Book a demo

Let's connect

Scroll to Top